Richest Counties in Oregon (2026)
by Kristen Carney
Updated: February 9, 2026
Richest County in Oregon
The richest county in Oregon is Washington County with an average household income of $137,880 as of 2024 and 603,947 people as of 2024 according to the most current Census data available (citation).
| Rank | County | Population | Average Income | Median Income |
|---|---|---|---|---|
| 1 | Washington County | 603,947 | $137,880 | $107,772 |
| 2 | Clackamas County | 423,975 | $137,176 | $103,517 |
| 3 | Deschutes County | 206,334 | $126,347 | $92,758 |
| 4 | Hood River County | 23,905 | $124,854 | $88,947 |
| 5 | Multnomah County | 801,477 | $122,099 | $88,766 |
| 6 | Yamhill County | 108,734 | $112,958 | $90,063 |
| 7 | Benton County | 96,303 | $110,290 | $77,702 |
| 8 | Polk County | 89,662 | $107,909 | $85,118 |
| 9 | Crook County | 26,277 | $104,053 | $81,965 |
| 10 | Columbia County | 53,493 | $100,740 | $87,458 |
| 11 | Marion County | 349,244 | $100,449 | $77,351 |
| 12 | Jackson County | 222,645 | $98,011 | $73,999 |
| 13 | Clatsop County | 41,363 | $97,117 | $71,822 |
| 14 | Jefferson County | 25,203 | $93,094 | $76,260 |
| 15 | Wasco County | 26,552 | $93,059 | $64,175 |
| 16 | Lane County | 384,207 | $92,524 | $71,544 |
| 17 | Morrow County | 12,300 | $89,689 | $75,448 |
| 18 | Linn County | 130,706 | $89,267 | $76,329 |
| 19 | Tillamook County | 27,496 | $87,737 | $69,105 |
| 20 | Union County | 26,144 | $87,276 | $65,661 |
Median Income versus Average Income: Which Should You Use?
We usually suggest using median income data – either instead of or in addition to – average income data as a true indicator of wealth. If you haven’t thought about median versus average since your last standardized test, you aren’t alone. Here’s what they are:
- average is the sum of a set of numbers divided by the count of numbers in the set
- median is the middle number in the set of numbers
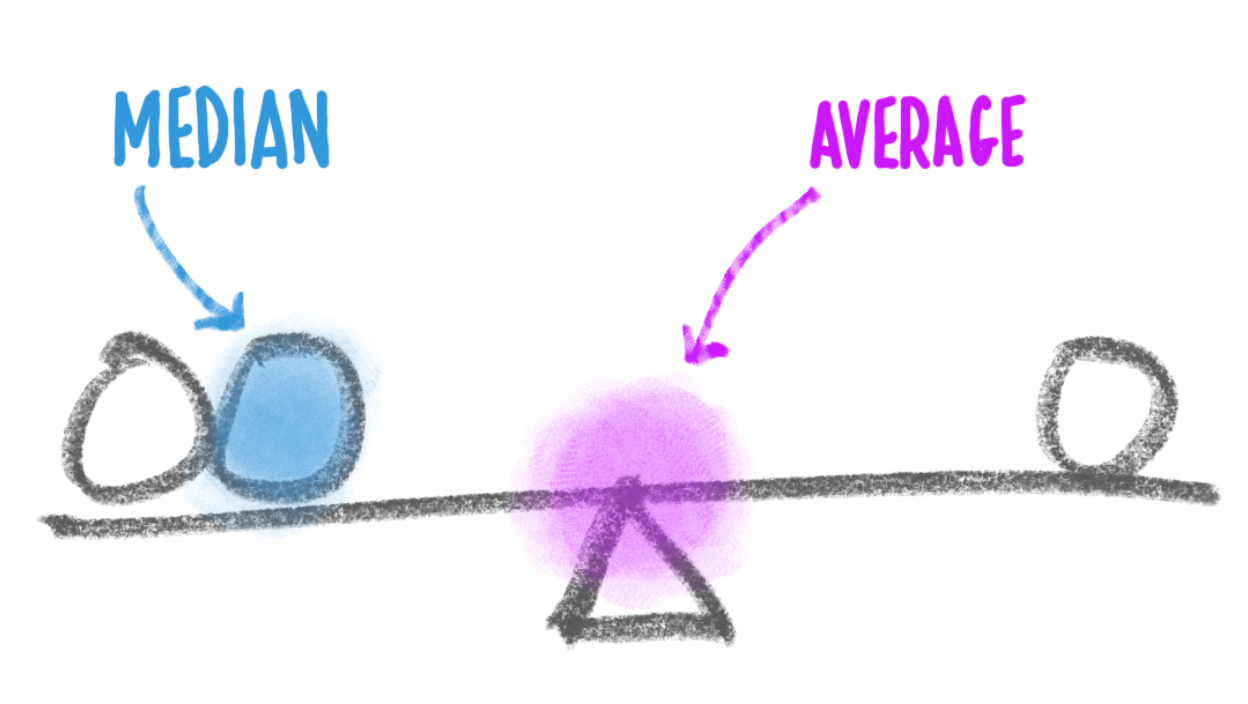
Now let’s say you had the following simplified set of income data.
Household 1: $30,000
Household 2: $50,000
Household 3: $1,000,000
The average income for this set is $360,000. The outlier data point ($1,000,000) skews the average WAY up. Conversely, the average income would be skewed WAY down if someone had an income of $500. The median income for the same data set is $50,000. Outlier data doesn’t skew the median.
Most Business Owners Should Use Median Income
So most business owners should use the median income as a true indicator of wealth, because it provides a more accurate representation of a typical income, especially in areas with significant income disparity.
When Should You Use Average Income
If your target market is high-income households, the average income may be more relevant. This is because the average income can highlight the presence of a higher concentration of wealthy individuals, which is beneficial for luxury goods and services marketing. We’re using average income on this page because using the Census’s highest reported median value of $250,001 could result in multiple ties for the richest geography.
Why do so many cities have a median value of $250,001?
The Census' American Community Survey uses $250,000+ as a jam value for median income estimates to protect privacy, ensure data consistency, and simplify reporting. A "jam value" in survey data refers to a placeholder or default value used when actual data points are unavailable, incomplete, or exceed certain thresholds. We represent this jam value as $250,001 to make it easy for you to sort.
You might also be interested in:
Email Me When New Data Are Released
Join thousands of subscribers and receive just 1 (ONE!) email a year in December when the US Census Bureau releases new income data for Oregon richest counties.
SOURCES
United States Census Bureau. Annual Estimates of the Resident Population: April 1, 2020 to July 1, 2024. U.S. Census Bureau, Population Division. Web. May 2025. http://www.census.gov/.
United States Census Bureau. B01001 SEX BY AGE, 2024 American Community Survey 5-Year Estimates. U.S. Census Bureau, American Community Survey Office. Web. 29 January 2026. http://www.census.gov/.
United States Census Bureau. B19013 Median Household Income, 2024 American Community Survey 5-Year Estimates. U.S. Census Bureau, American Community Survey Office. Web. 29 January 2026. http://www.census.gov/.
United States Census Bureau. “DP03 SELECTED ECONOMIC CHARACTERISTICS.” 2024 American Community Survey 5-Year Estimates. U.S. Census Bureau, American Community Survey Office. Web. 29 January 2026. http://www.census.gov/.
Products & Services
Plumbing
Connect
- 1-800-939-2130
- Contact Us
© Copyright 2026 Cubit Planning, Inc.